Your production server is running at 90% CPU and you have no idea why. top shows a dozen processes but none are the culprit. perf needs root and slows everything down. You need answers now, not after the next outage.
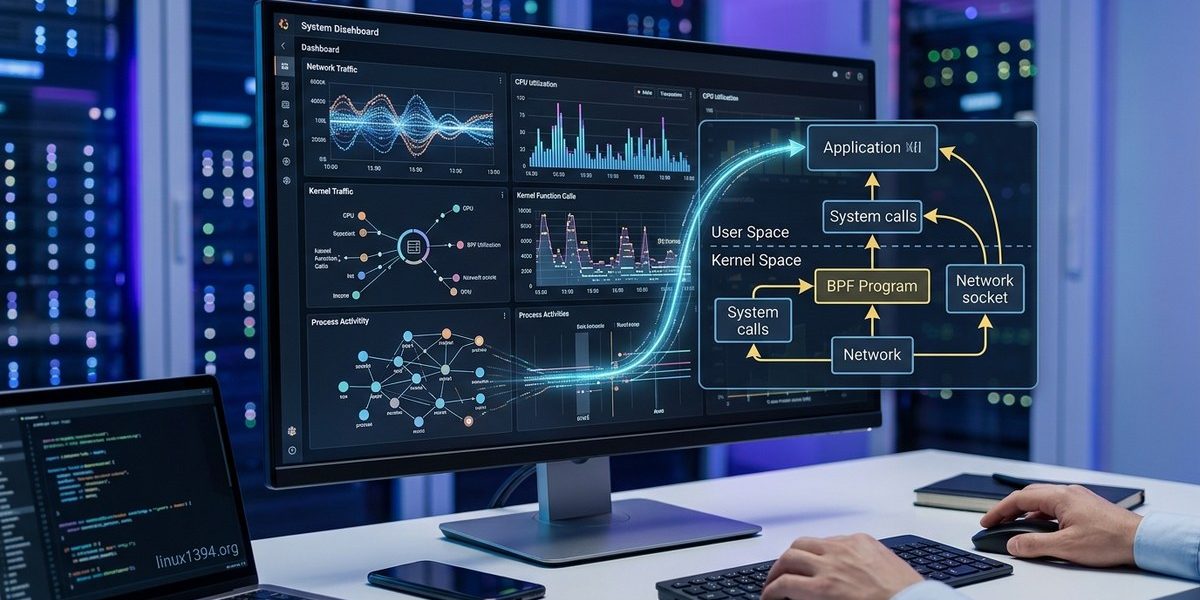
That is where eBPF comes in. Extended Berkeley Packet Filter lets you run sandboxed programs inside the Linux kernel without changing kernel code or loading modules. For real-time monitoring, eBPF gives you visibility into system calls, network packets, file operations, and memory events at the moment they happen. No polling, no context switching overhead. Just data.
This guide walks you through using eBPF for real-time Linux system monitoring. You will learn what makes eBPP special, how to write a simple monitoring program, what metrics matter most, and how to avoid common pitfalls.
eBPF enables real-time kernel-level monitoring with minimal overhead. By attaching small programs to tracepoints, kprobes, and network hooks, you can capture system calls, file I/O, and network events as they occur. The BCC and bpftrace tools make writing eBPF programs accessible without deep kernel knowledge. Start with simple one-liners and scale up to custom monitoring pipelines that filter 90%+ of events before they reach userspace.
What makes eBPF different for real-time monitoring
Traditional monitoring tools like sar, iostat, or vmstat rely on polling. They read /proc files or call kernel interfaces at fixed intervals. That means events between polls are invisible. eBPF flips that model. Your monitoring code sits directly in the kernel path. When a system call happens, your eBPF program runs instantly and can record a timestamp, extract arguments, or aggregate data.
Because eBPF programs are verified before they load, the kernel guarantees they will not crash or hang. This safety is critical for production systems. You can attach monitoring to any function or tracepoint without fear of destabilizing the kernel.
For real-time work, the key advantage is latency. eBPF programs run in kernel context with nanosecond precision. Data can be sent to userspace via perf events or BPF maps, but the collection itself happens at the moment of the event. You see what the system is doing right now, not what it did a second ago.
Getting started with your first eBPF monitoring program
Let us build a simple real-time monitor that tracks open() system calls. This will show you the file paths being accessed across the whole system. We will use BCC (BPF Compiler Collection), which is the most approachable framework for sysadmins.
-
Install BCC on your 2026 Linux distribution. For Ubuntu 24.10 or Fedora 41, use
apt install bpfcc-toolsordnf install bcc. The package includesexecsnoop,biolatency, and dozens of other ready-made tools. -
Write a small eBPF C program. BCC compiles it to BPF bytecode at runtime. Here is a minimal example that counts
opencalls per process:
c

   #include <uapi/linux/ptrace.h>

   #include <uapi/linux/limits.h>

   struct key_t {

       u32 pid;

       char name[TASK_COMM_LEN];

   };

   BPF_HASH(counts, struct key_t);

   int trace_open(struct pt_regs *ctx, const char __user *filename) {

       struct key_t key = {};

       key.pid = bpf_get_current_pid_tgid() >> 32;

       bpf_get_current_comm(&key.name, sizeof(key.name));

       counts.increment(key);

       return 0;

} -
Attach the program to a tracepoint. The tracepoint
syscalls:sys_enter_openatfires every time a process opens a file. In a Python script using BCC:
python

   from bcc import BPF

   b = BPF(src_file="monitor_open.c")

b.attach_tracepoint(tp="syscalls:sys_enter_openat", fn_name="trace_open") -
Read the results in real time. Loop over the BPF map every second and print the top processes. You can output to stdout or push to a time-series database.
-
Add filtering. To focus on specific file paths or exclude noise like shared libraries, insert an early return in your eBPF program. For example, skip any path that starts with
/usr/lib. -
Set a watchdog timer. eBPF programs have a maximum execution time (usually microseconds). For long running monitoring, use maps to aggregate and a userspace agent to periodically read and clear counters.
This six-step process gives you a production-ready file access monitor in under an hour. You can adapt the same pattern for any system event.
Key metrics you can capture with eBPF
eBPF covers almost every subsystem in the Linux kernel. Here are the most useful for real-time troubleshooting:
- System call frequency and latency. Track how often each syscall is invoked and how long it takes. Great for finding misbehaving applications.
- File I/O operations. Monitor reads, writes, opens, and closes per file or per process. Use
filetoporfileslowerfrom BCC. - Network packet handling. Use XDP (eXpress Data Path) or TC hooks to inspect packets at wire speed. Count TCP connections, measure RTT, or detect drops.
- Context switches and CPU scheduling. See how often your process yields the CPU or gets preempted.
runqlatshows scheduler latency. - Memory allocation. Track
kmalloc,mmap, orbrkcalls. Identify memory leaks without restarting the process. - Block device I/O. Monitor disk reads and writes per request.
biolatencyshows histograms of I/O wait times. - Process life cycle. Know exactly when a process forks, execs, or exits. Essential for container security audits.
All these metrics are collected at the moment of the event, not from periodic snapshots. That distinction matters when you are diagnosing a transient spike.
Common mistakes and how to avoid them
| Mistake | Consequence | Solution |
|---|---|---|
| Not setting a maximum map size | eBPF map grows unbounded, consuming kernel memory. | Limit maps with max_entries and use LRU eviction when appropriate. |
| Using blocking functions in the kernel | Program returns error and may crash the attached tracepoint. | Only use BPF helper functions; never call printk or msleep. |
| Monitoring too many events | Userspace reader cannot keep up; events are dropped. | Filter early in the eBPF program. Aggregate in the kernel. |
| Forgetting to check return codes | Missed attachments, no output, silent failure. | Always verify that attach_tracepoint or attach_kprobe returns success. |
| Running untrusted eBPF programs | Verifier rejects the program due to loops or unsafe memory access. | Use BCC or libbpf with known patterns. Test on a dev host first. |
The table above covers the most common pain points for new users. The last item is especially important: eBPF verifier enforces strict safety rules. You cannot write arbitrary loops. If your program fails verification, look for use of bpf_loop (available since kernel 5.17) or restructure your logic to avoid unbounded iteration.
Expert advice: Start with
bpftracefor one-liners. It uses a high-level awk-like syntax and handles all the complexity of map setup and event attachment. For example,bpftrace -e 'tracepoint:syscalls:sys_enter_open { printf("%s %s\n", comm, str(args->filename)); }'prints every file open in real time. Once you need more control, graduate to BCC or libbpf with C. But for 80% of monitoring tasks, bpftrace is all you need.
Advanced techniques for filtering events at the kernel level
Real production environments generate enormous event volumes. A busy web server may issue millions of system calls per second. You cannot push all of them to userspace. The solution is in-kernel filtering.
With eBPF, you can discard events before they ever leave the kernel. For example, if you only care about writes to /var/log/, you can add a string comparison in your eBPF program:
if (filename[0] != '/' || filename[1] != 'v' || ...) return 0;
This pattern, often called an approver, passes only matching events to the perf ring buffer. The rest are discarded at the tracepoint.
You can also use BPF maps to dynamically update filters without recompiling. For instance, store a list of PIDs to monitor in a map. The eBPF program checks the current PID against the map and returns early if the PID is not in the set. To change the filter, your userspace agent writes a new PID into the map.
This approach is how tools like Datadog and Cilium scale eBPF to billions of events per minute. They move the filtering logic as close to the event source as possible, often inside the eBPF program itself. The result is a monitoring system that collects only what you need, with minimal CPU overhead.
For deeper kernel debugging, consider using https://linux1394.org/mastering-kernel-debugging-techniques-for-linux-developers/ alongside eBPF. The two approaches complement each other: eBPF for real-time monitoring, traditional debugging for root cause analysis.
Putting eBPF to work in your infrastructure
You do not need to be a kernel developer to get value from eBPF. Start with the prebuilt tools in BCC. Run execsnoop on a busy server and watch every new process appear. Use tcptracer to see TCP connections as they open. These tools are safe, ready to use, and give you immediate insight.
Once you feel comfortable, write a custom eBPF program for your specific monitoring need. Maybe you want to track writes to a specific database file, or measure latency of a particular ioctl call. The pattern is always the same: attach to a tracepoint or kprobe, extract the data you care about, aggregate in a map, and read it from userspace.
The kernel community continues to add new hooks and features. In 2026, eBPF supports sleepable programs, user ring buffers for high-throughput data transfer, and better integration with cgroups. The barrier to entry keeps getting lower.
Go ahead. Install the tools, run bpftrace on your development machine, and see what your kernel is actually doing. Real-time visibility is no longer reserved for enterprise vendors. With eBPF, you have that power built right into Linux.